Statistics and Probability Worksheets
About Our Statistics and Probability Worksheets
Our Statistics and Probability worksheets provide a thorough and engaging exploration of key concepts that are essential for understanding and analyzing data in the real world. These worksheets cover a wide range of topics, from basic probability to more complex statistical analyses, making them an invaluable resource for students who want to develop strong analytical skills.
Each category within our Statistics and Probability collection contains several worksheet sets, each focusing on a specific aspect of the topic. These sets are designed to gradually build students' knowledge and confidence.
A Look At Each Worksheet
Business Odds
Get ready to peek behind the curtain of commerce, where probability meets the marketplace. In this worksheet, students explore how chance influences everyday business decisions, from sales forecasts to guessing customer counts. It's like "Shark Tank" for probability-except without the sharks, and way more math (but still just as cool).
Conditional Puzzle
A logic lover's dream disguised as a worksheet. Here, students navigate "if-then" branches of probability, uncovering how one event affects another's chance to happen. It's fun-size brain gymnastics-twisty, clever, and perfect for sparking that "aha!" lightbulb moment.
Data Puzzle
An on-its-face innocent worksheet that's actually a secret code breaker: students decipher patterns buried in datasets. Each puzzle encourages reading between the rows and columns, turning data into detective work. Expect giggles as they realize numbers can tell stories-and they're the authors.
Data Spread
Say hello to range, variance, and those delightful little spreads that show how wild a data set really is. Students will see how "spread-out" data can feel-like marshmallows scattered across a pan-together with mean, median, and mode to anchor the fun. It's both tactile and analytical, sure to satisfy their inner storyteller and statistician alike.
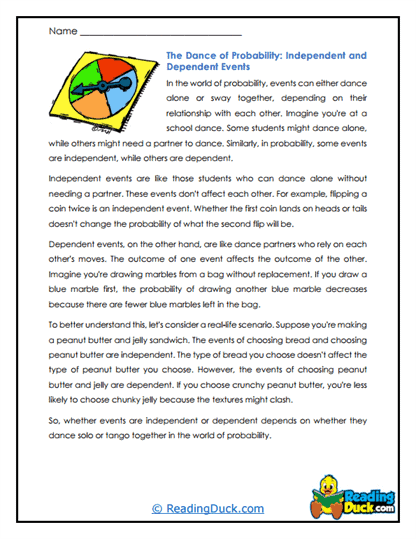
Event Dance
Part probability lesson, part party invitation. Students step through sequences of events, learning how probability shifts when you change the order-not unlike choreographing a dance. It's rhythmic, it's dynamic, and yes, it might make them want to boogie while calculating likelihoods.
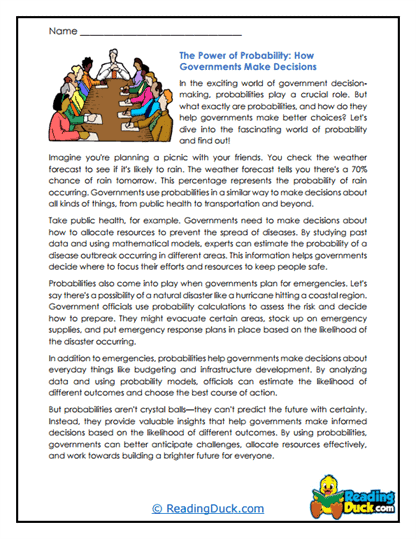
Gov Decision
Enter the world of civic math, where probability and statistics influence policy and decisions. This worksheet frames scenarios where students weigh outcomes-like public votes or surveys-and practice making choices based on data. It's a gentle reminder that math shapes our society (and yes, they might feel like mini-governors).
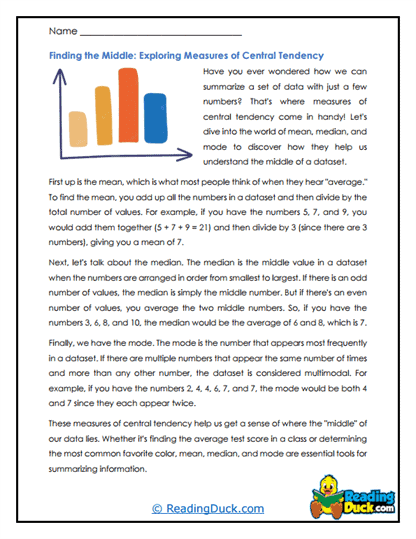
Middle Measures
A cozy term for mean, median, and mode, and oh, how crucial they are! This worksheet lets students cozy up to the "middle" of data, finding the middle value, the balancing point, and the most popular number. It's familiar territory with a twist: they leave understanding the heart of datasets, not just the edges.
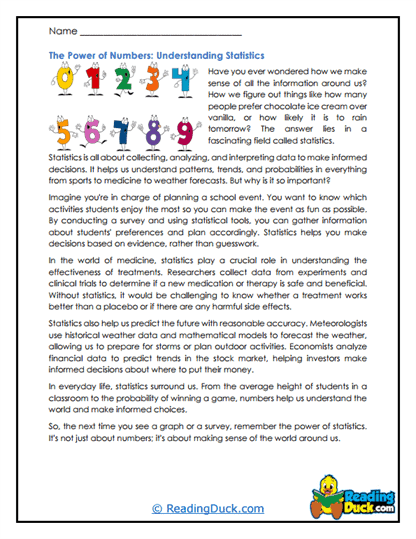
Statistics Power
Charging into the realm of statistical muscles, this one flexes concepts like averages, distribution, and what numbers really mean. Students learn to ask: are my findings just a fluke, or do they pack real power? Think of it as teaching how to read data like a boss-with both brain and bravado.
Stats Difference
Comparison time! This worksheet invites students to pit groups of data against each other-maybe class A vs. class B, or apples vs. oranges (figuratively speaking). They'll calculate differences and interpret what they tell us. It's slightly competitive, decidedly analytical, and 100% enlightening.
Winning Moves
Last, but definitely not least, this gem turns probability into strategy-like a game where you must choose your move to win. Students evaluate outcomes, make predictions, then take their best shot. Spoiler: the real victory lies in connecting reading comprehension with critical thinking and probability.
Understanding Data and Chance
Statistics and Probability are essential branches of mathematics that allow us to make sense of data and understand the likelihood of events. When teaching these topics, it's important to emphasize how they apply to real-world situations and how they help us make informed decisions based on data.
Key Aspects of Statistics and Probability:
- Introduction to Probability: Probability is the study of how likely events are to occur. It provides a mathematical framework for predicting the outcomes of random processes. In this section, students learn about basic probability concepts, including the calculation of simple probabilities, understanding probability as a fraction or percentage, and exploring probability through experiments and simulations.
- Counting Principles and Combinatorics: Counting principles, such as permutations and combinations, are essential for calculating probabilities in more complex situations. Students learn how to apply these principles to determine the number of possible outcomes in a scenario, which is crucial for understanding probability distributions and making predictions.
- Descriptive Statistics: Descriptive statistics involve summarizing and describing data sets using measures such as mean, median, mode, range, and standard deviation. These concepts help students understand how data is distributed and what the central tendencies and variability of the data tell us about a particular situation.
- Data Representation: In this section, students explore various ways to represent data visually, including histograms, bar graphs, pie charts, box plots, and scatter plots. Understanding how to interpret and create these representations is essential for analyzing and communicating data effectively.
- Probability Distributions: Probability distributions describe how probabilities are distributed over different outcomes. Students learn about common probability distributions, such as the binomial distribution and normal distribution, and how to use these distributions to model real-world scenarios.
- Inferential Statistics: Inferential statistics allow us to make predictions or inferences about a population based on a sample of data. This section introduces students to concepts like confidence intervals, hypothesis testing, and the use of statistical tests to determine the significance of results.
- Correlation and Regression: Students learn about the relationship between two variables through correlation and regression analysis. These concepts help students understand how one variable might predict or influence another, which is useful for making informed decisions in various fields such as economics, biology, and social sciences.
- Experimental Design and Sampling Methods: Understanding how to design experiments and select appropriate samples is crucial for collecting reliable data. In this section, students explore different sampling methods, learn how to avoid bias, and understand the importance of randomization in experimental design.
By exploring these key aspects of statistics and probability, students can develop strong analytical skills that are essential for making sense of data in the real world. Statistics and Probability are not just about numbers-they are about understanding patterns, making predictions, and making informed decisions based on data.
Examples of Real-World Applications
Statistics and Probability are not just theoretical concepts; they have many practical applications that are critical for various fields. Here are some examples of how statistics and probability are used in the real world:
- Weather Forecasting: Meteorologists use probability and statistical models to predict weather patterns. By analyzing historical data and current conditions, they can estimate the likelihood of different weather events, such as rain or snow.
- Healthcare and Medicine: In healthcare, statistics are used to analyze patient data, track the spread of diseases, and determine the effectiveness of treatments. Probability is crucial in clinical trials to assess the likelihood that a new drug or treatment will have a beneficial effect.
- Business and Economics: Businesses use statistical analysis to make informed decisions about marketing, production, and investment. Probability models help companies assess risks, forecast demand, and optimize pricing strategies.
- Sports Analytics: In sports, statistics are used to evaluate player performance, develop strategies, and predict the outcomes of games. Probability models are also used in sports betting and fantasy sports to estimate the likelihood of various outcomes.
- Quality Control: Manufacturing companies use statistics to monitor product quality and ensure that production processes meet standards. Statistical process control involves using data to detect variations in the production process and make necessary adjustments.
- Polls and Surveys: Polling organizations use statistics to analyze survey data and make predictions about public opinion, election outcomes, and social trends. Probability sampling methods help ensure that survey results are representative of the broader population.
- Insurance and Risk Management: Insurance companies use probability and statistics to assess risks and determine premiums. By analyzing data on accidents, health conditions, and other factors, they can estimate the likelihood of different events and set prices accordingly.
- Education: In education, statistics are used to assess student performance, evaluate the effectiveness of teaching methods, and conduct research on educational outcomes. Probability helps in analyzing test scores, predicting student success, and making data-driven decisions in education policy.
These examples show that statistics and probability are powerful tools that influence many aspects of our lives. They help us make sense of complex data, predict outcomes, and make informed decisions in various fields.