Bubble Maps Worksheets

About Our Bubble Maps
In the ever-evolving world of education, tools that simplify complex concepts and inspire critical thinking are game-changers. One such resource is the Bubble Map-a dynamic graphic organizer that visually connects ideas and their defining attributes. This page dives into the power of Bubble Map Worksheets, offering printable, ready-to-use templates that can transform the teaching and learning experience. By exploring what Bubble Maps are, how they work, and their unique benefits, students and educators can discover new ways to make learning both engaging and effective.
At the heart of the Bubble Map's design lies its ability to visually organize information. Unlike traditional, linear note-taking methods, Bubble Maps place a central concept at the core, surrounding it with "bubbles" that represent related attributes or descriptors. This visual format highlights relationships between ideas, providing a clear snapshot of how each detail connects to the bigger picture. The result? Learners can absorb, process, and recall information more effectively, improving both understanding and memory retention.
A Look At Each Bubble Map
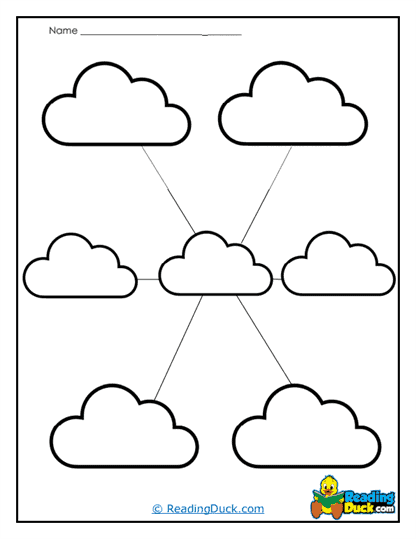
Cloud Connections
This organizer places a central idea and surrounds it with "cloud" bubbles containing associated images, words, or thoughts. It visually conveys how different elements relate back to the central theme, fostering quick association. The fluffy, cloud-like shapes make connections feel fluid and atmospheric. This structure encourages learners to freely associate without worrying about order or hierarchy. It's especially friendly for brainstorming or exploring emotions and abstract concepts. Its airy layout supports creative thinking and makes ideas feel light and approachable.
Flow Map
A Flow Map presents a series of bubbles connected in a directional sequence, much like a path or timeline. Each bubble shows a step or stage in a process, with arrows or lines indicating order. It helps clarify chronological events, as well as cause-and-effect sequences. The flowing design visually leads the learner from start to finish. It reinforces logical progression and the idea that each part builds on the previous one. This organizer structure supports comprehension of systems, stories, and cycles.
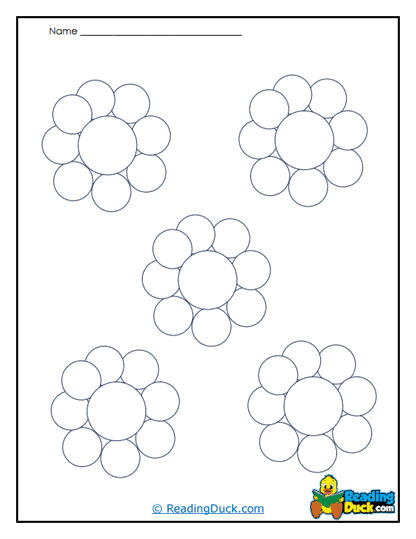
Flower Map
A Flower Map spreads petals around a central concept, with each petal containing a related idea or descriptor-like "petals" of information. The circular, floral design suggests growth and expansion, and the visual metaphor of blossoming can inspire curiosity. Each petal holds a specific attribute or example related to the center topic. The flowing, natural structure supports organization while hinting at organic learning. It's both structured and visually engaging.
Happy Hub
This organizer centers a positive idea-like "happy"-and radiates joyful or uplifting attributes outward. The design likely includes cheerful visuals and supportive labels around a central mood or theme. It's built to encourage positive associations and mirror emotional or motivational themes. The "hub-and-spoke" design keeps the focus centered while radiating energy around it. It's affirming visually and cognitively.
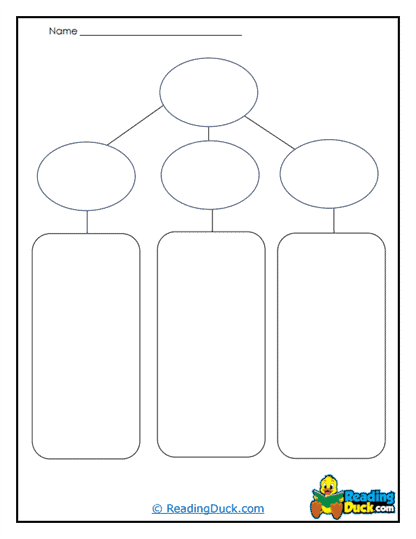
Hierarchy Chart
A Hierarchy Chart structures bubbles in ranked order, showing relationships of status, importance, or levels. It visually represents how ideas or items relate in a vertical or layered fashion. The design clarifies order and dependency, with top-level concepts leading down to subcategories. The chart helps learners see structure and organization clearly. It fosters analytical thinking about systems, ecosystems, or organizational roles.
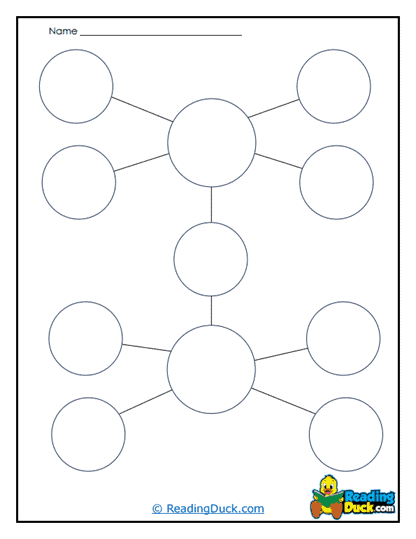
Idea Ladder
The Idea Ladder visualizes progression or escalation with bubbles arranged like steps or rungs. Ideas climb vertically or horizontally, showing building complexity or stages toward a goal. Each bubble represents a step up or level in thinking. The "climbing" visual encourages learners to build on what they know. It supports scaffolding of ideas and reflection on growth.
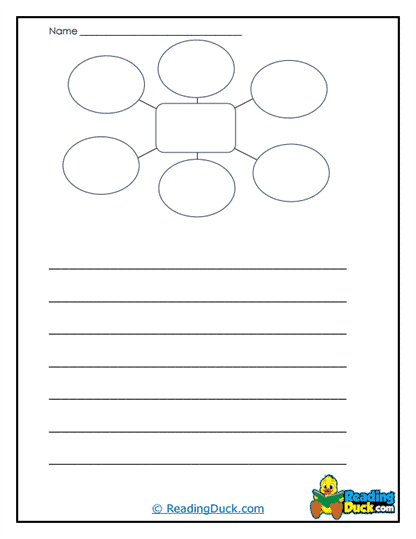
Idea Web
An Idea Web connects ideas in a non-linear network, with multiple bubbles interlinked in a web around a central concept. It supports complex thinking, showing how ideas overlap or interconnect. Each bubble can link to the center or to other bubbles, illustrating relationships. It mirrors how real-world ideas interrelate rather than follow a strict pattern. This organizer is dynamic, flexible, and perfect for brainstorming with multiple threads of thought.
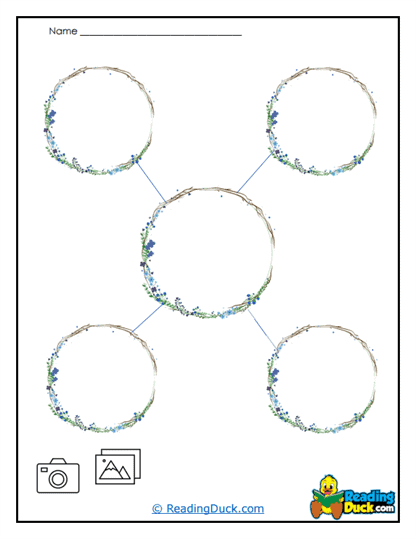
Nature Web
Similar in structure to an Idea Web, a Nature Web uses a central natural concept (like a habitat or ecosystem) and shows how different elements interconnect and support one another. It emphasizes environmental relationships and how every part of nature plays a role. The design can include organic visuals and lines to resemble natural webs or ecosystems. It teaches systems thinking and environmental awareness.
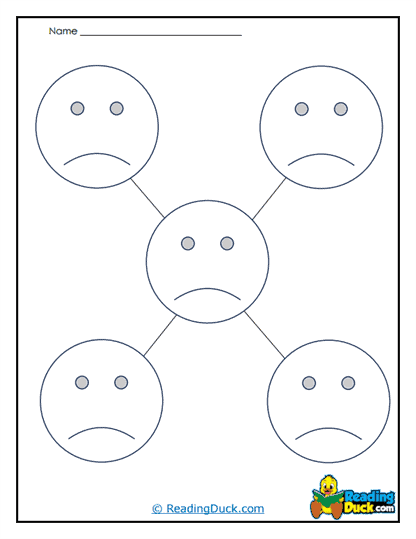
Sad Scheme
A Sad Scheme places a central sad topic or feeling and surrounds it with bubbles that explore causes, effects, or related emotions. The somber design invites exploration of feelings or challenging topics in a structured way. It supports emotional literacy and thoughtful reflection. The framing helps learners unpack negative themes safely and constructively.
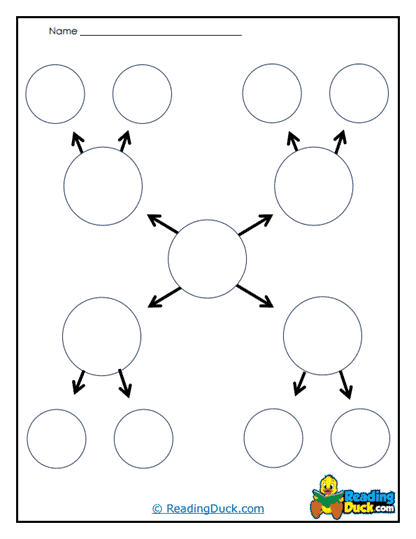
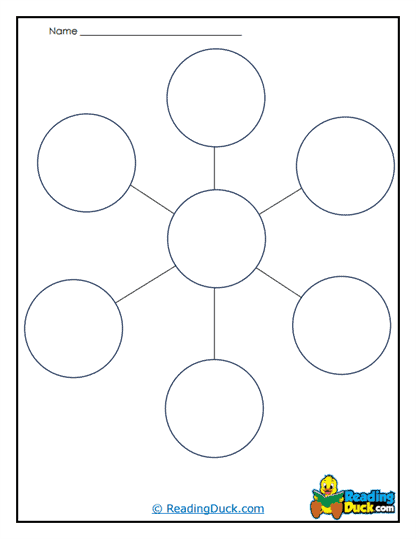
Starburst Planner
The Starburst Planner is a radial organizer where each point radiates from the center like a starburst, with each ray representing a question, idea, or angle on the central topic. It encourages exploration from multiple perspectives. The design feels dynamic, energetic, and perfect for inquiry.
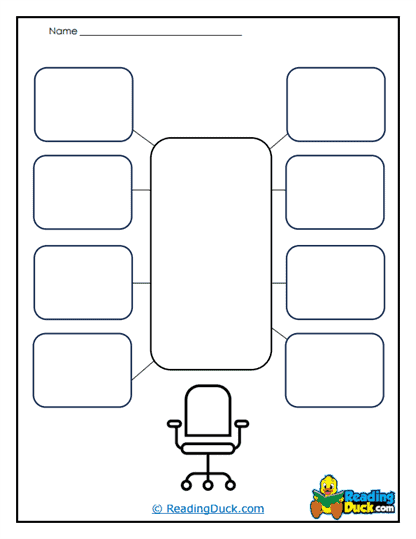
Team Table
A Team Table structures bubbles into rows or columns like a table, categorizing ideas by role, group, or theme. It's structured but still visual, helping compare across categories. It blends organizer clarity with visual spacing to support collaborative thinking.
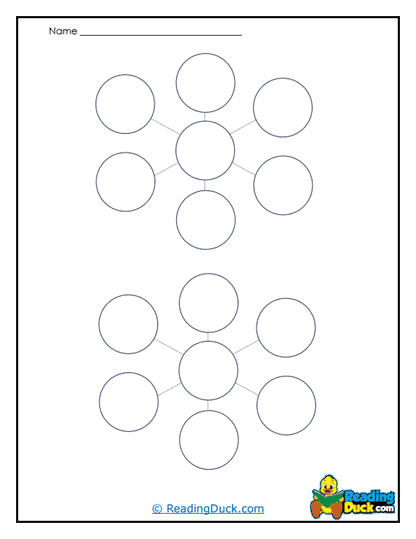
Twin Maps
Twin Maps present two central ideas side-by-side, each with its own cluster of bubbles. It's essentially two Bubble Maps next to each other, enabling comparisons or dual explorations. Great for visual side-by-side contrast.
The Benefits of Using Bubble Maps
Enhancing Critical Thinking Skills
Bubble Maps play a pivotal role in developing critical thinking skills by prompting students to identify and analyze the key attributes of a concept. Unlike traditional rote learning methods, they require learners to actively engage with the material, breaking it into smaller, more meaningful components. This process encourages students to go beyond surface-level understanding and dive deeper into the connections between ideas. For example, analyzing the attributes of a historical figure in a Bubble Map might reveal patterns in their decisions and the broader implications of their actions. Through this method, students cultivate the ability to think logically and evaluate information from multiple perspectives, skills that are invaluable both inside and outside the classroom.
These types of graphic organizers provide a platform for learners to reflect on their reasoning and validate their ideas. By organizing information visually, they can identify gaps in their understanding or discover areas that require further exploration. This approach not only sharpens analytical abilities but also boosts confidence as students build a stronger foundation of knowledge. Moreover, the collaborative use of Bubble Maps in group activities fosters discussion, critical questioning, and peer-to-peer learning, further enhancing cognitive development. Over time, students who use these tools regularly develop a habit of critical analysis that extends to all aspects of their learning journey.
Boosting Memory Retention
The visual nature of Bubble Maps significantly aids in improving memory retention, as they capitalize on the brain's ability to process visual information more effectively than text alone. Studies show that people are more likely to remember information when it is presented in a structured, image-based format. By associating a central concept with its various attributes in a Bubble Map, learners create strong visual cues that act as "mental anchors." These cues simplify the recall process, enabling students to retrieve specific details quickly, whether during a class discussion or a challenging exam. The process of constructing a Bubble Map itself reinforces memory, as learners actively engage with the content and make it their own.
In addition to improving recall, Bubble Maps enhance long-term retention by encouraging the synthesis of information. When students group attributes around a central concept, they create meaningful connections that transform isolated facts into a cohesive framework. For instance, visualizing the causes and effects of a historical event using a Bubble Map helps learners see the "big picture" while remembering specific details. This dual benefit of clarity and retention makes Bubble Maps an indispensable tool for mastering complex subjects, reducing the stress of forgetting critical information, and improving overall academic performance.
Improving Organizational Skills
Bubble Maps excel at helping students organize their thoughts in a clear, systematic way. Unlike traditional lists or linear notes, Bubble Maps provide a structured yet flexible framework where ideas can be visually grouped and prioritized. This organization eliminates the clutter of scattered information, allowing students to focus on the key elements of a topic. For instance, when preparing for an essay, a Bubble Map can help a student visually outline the main argument and supporting points, ensuring that all ideas are relevant and logically connected. This clarity not only makes tasks more manageable but also boosts the efficiency of the learning process.
They are an excellent tool for teaching students how to structure their work effectively. Whether used for outlining a research project, preparing for a presentation, or reviewing material for a test, they guide learners in breaking down large tasks into smaller, actionable steps. This approach builds strong organizational habits, teaching students to prioritize information and maintain focus. Over time, the ability to create and use Bubble Maps empowers learners to approach complex problems with confidence and competence, setting them up for success in both academic and real-world settings.
Tips for Effective Usage
To fully unlock the potential of Bubble Maps, it's essential to approach their use with intentionality and creativity. These best practices ensure students can maximize their learning experience and harness the full power of this visual tool.
Start with a Clear Central Idea
Begin by defining a single, well-focused concept to serve as the center of the Bubble Map. A vague or overly broad central idea can dilute the map's effectiveness, so clarity is key. For example, instead of choosing "Science," select a more specific topic like "Photosynthesis" or "Newton's Laws of Motion." This focus ensures that all surrounding attributes directly relate to the central idea, creating a cohesive and meaningful visual representation. Starting with a clear concept sets the stage for organized thinking and paves the way for deeper exploration.
Use Specific Attributes
When populating the surrounding bubbles, aim for precision by using concrete attributes or detailed descriptors. Avoid generic or vague terms, as they fail to add value to the central concept. For instance, instead of writing "good" to describe a character in literature, use more specific terms like "compassionate," "courageous," or "empathetic." Specific attributes encourage deeper analysis and ensure the map serves as a detailed resource for study or discussion. This practice also helps students articulate their understanding more effectively, fostering both clarity and critical thinking.
Incorporate Color and Imagery
Enhance the visual appeal and memory-aiding properties of the Bubble Map by adding colors and small illustrations. Colors can be used strategically to group related ideas or emphasize key points, making the map easier to interpret at a glance. Small, relevant drawings, such as a sun for "energy" in a photosynthesis map, can reinforce the connection between the concept and its attributes. These visual elements not only make the process more engaging but also help learners retain information longer. A colorful and illustrative Bubble Map is not just a tool-it becomes an interactive and enjoyable part of the learning experience.
Review and Refine
Encourage students to revisit and refine their Bubble Maps as their understanding deepens. Learning is an ongoing process, and the map should evolve along with it. As new information is gained, students can add details, adjust attributes, or even reorganize ideas for better clarity. This iterative approach ensures the map remains accurate and comprehensive, transforming it into a living document that grows over time. Regular reviews also help reinforce previously learned concepts, making it an indispensable tool for long-term learning and retention.
Psychological and Cognitive Impacts
Bubble Maps are grounded in the principles of dual-coding theory, which suggests that combining visual and verbal information enhances learning. This theory highlights how presenting information visually-alongside verbal explanations-engages both hemispheres of the brain. The left hemisphere processes logical, verbal details, while the right hemisphere interprets spatial and visual information, creating a synergistic learning experience. By using them, students activate both sides of their brain, which not only improves comprehension but also strengthens memory retention. This dual engagement makes learning more effective, helping students better grasp and recall even the most complex topics.
Enhancing Comprehension
When students use these types of graphic organizers to visually map out the attributes of a concept, they go beyond rote memorization and engage in active learning. This process helps them break down abstract ideas into manageable, tangible components, making it easier to understand the overall concept. For instance, mapping the causes and effects of a historical event visually demonstrates interconnected relationships that might remain hidden in a purely text-based format. This active engagement encourages students to think critically about how ideas relate to one another, fostering deeper comprehension. By visualizing information, learners can make sense of intricate topics in a way that feels intuitive and accessible.
Improving Recall
The organized structure of Bubble Maps is particularly beneficial for improving recall, especially when students need to retrieve information under pressure. The spatial arrangement of ideas around a central concept creates a mental "map" that students can recreate during tests, discussions, or problem-solving activities. For example, a student studying biology might remember a Bubble Map about the cell structure and mentally visualize the nucleus surrounded by attributes like "DNA" or "regulation of cell activities." This mental reconstruction aids in retrieving specific details with ease, reducing stress and boosting confidence. Over time, this practice enhances both short-term recall and long-term memory, making Bubble Maps a powerful study tool.