Venn Diagrams Worksheets


About Our Venn Diagrams
A Venn Diagram is a graphical organizer that visually represents the relationships between different sets of items, ideas, or concepts. It consists of overlapping circles, each representing a set. The areas where the circles overlap show the commonalities between the sets, while the non-overlapping areas highlight the differences. Venn Diagrams are powerful tools for comparing and contrasting, identifying shared attributes, and understanding how sets intersect or differ.
The concept is named after John Venn, a British logician and philosopher who introduced it in 1880. Venn Diagrams were originally used in logic and set theory to illustrate relationships in mathematics, but their applications have since expanded to education, problem-solving, and various real-world scenarios.
A Look At Our Venn Diagrams
Balanced View
This organizer is designed to help students explore multiple sides of a topic or argument, with regions for agreements, disagreements, and nuance. The Venn diagram structure simplifies complex viewpoints by visually displaying how ideas overlap or stand apart. It's particularly effective when facilitating critical thinking, promoting balanced reflection, or weighing pros and cons.
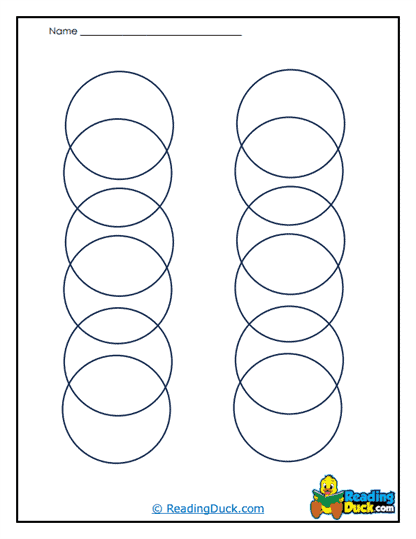
Bubble Ladder
This layout layers multiple Venn circles vertically, forming a ladder-like progression of ideas or sets. Each rung adds a new comparison to the mix, allowing students to see how relationships evolve with additional elements. It's ideal for exploring a series of related themes or characters in a structured, step-by-step way.
Comparison Grid
Combining grid structure with overlapping circles, this organizer offers neatly aligned rows and columns for systematic comparisons. Each cell blends uniqueness and overlap visually, helping students track similarities and differences clearly. It works well for analyzing a range of categories or subjects side by side.
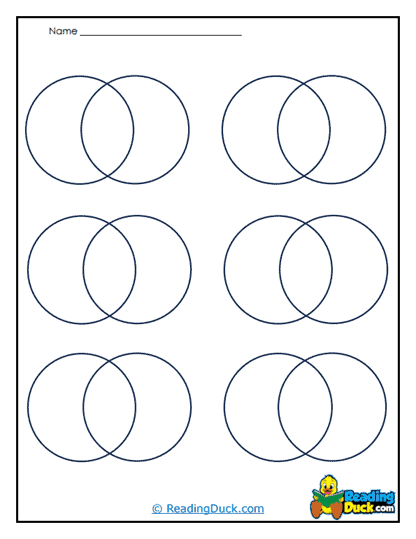
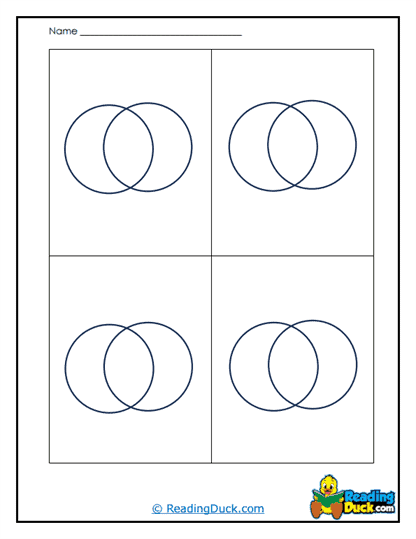
Double Duo
Here, two pairs of overlapping circles are arranged for dual comparisons-ideal for examining two sets with respect to two different criteria. Students can compare in pairs and also explore overlaps across the duos in a single visual. It supports multifaceted analysis, such as comparing characters across traits or scenarios.
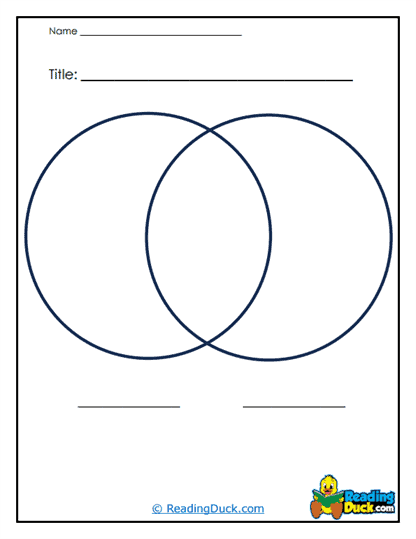
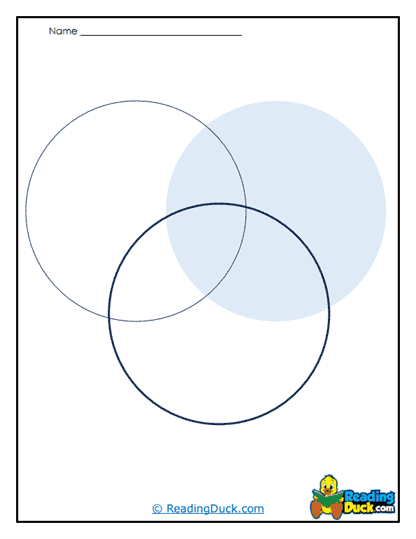
Dual Focus
This version uses two primary circles with balanced visual emphasis, each capturing a central idea or category. The shared area highlights overlaps, whereas the individual circles capture distinctions. It's a classic Venn setup refined for focused contrasts-perfect for straightforward side-by-side analysis.
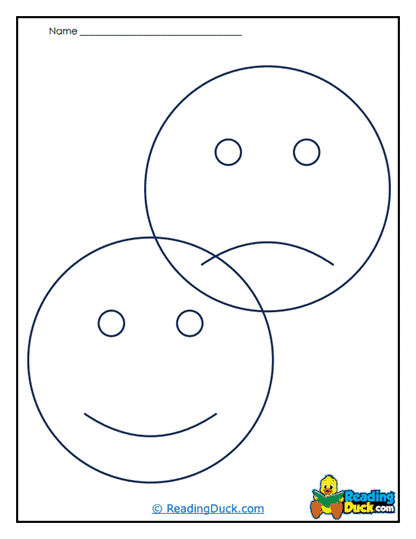
Emotion Compare
This organizer maps two emotional states or feelings, showing where they intersect and diverge in student understanding or experience. It encourages reflection on emotional nuance and helps learners articulate overlapping or contrasting emotional responses. Great for social-emotional learning or character empathy exercises.
Overlap Zone
This layout emphasizes the central overlapping region, visually spotlighting the shared attributes between sets. Surrounding areas still highlight uniqueness, but the design draws special attention to intersection. Useful for encouraging students to dig deeper into common ground and shared concepts.
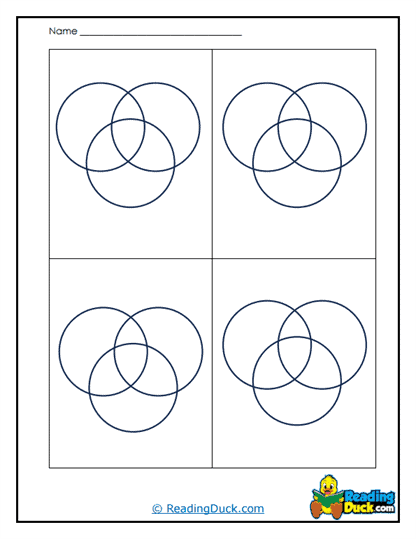
Quad Compare
Organized into four overlapping circles, this tool captures a web of relationships among multiple concepts or characters. Each intersection zone represents layered connections, enabling nuanced comparison across several ideas. It's ideal for complex analysis where students must consider more than two sets.
Quick Pairs
A simplified, speedy Venn layout for two items-perfect for quick-thinking exercises or spontaneous comparisons. It allows students to jot down a few key similarities and differences in a clean, efficient format. Ideal for warm-ups, exit tickets, or brief reflection moments.
Three-Level View
With three concentric or overlapping circles, this organizer layers comparisons from simple to complex. Students can track similarities between just two sets in inner overlaps, while all three converge in the center for deeper commonality. It works well for developing layering insight or adding progressive depth to comparisons.
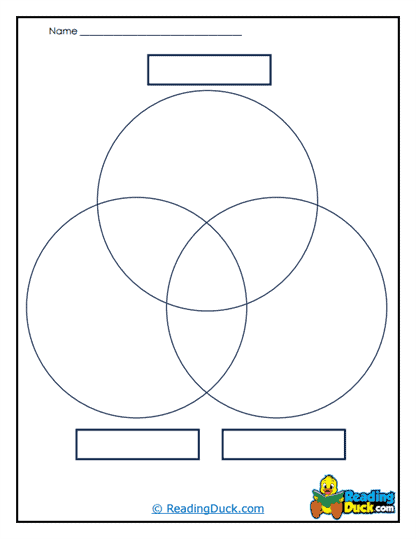
Triple Connection
This map connects three ideas, themes, or items through overlapping areas-highlighting dual and triple intersections. It allows examination of how all three overlap and where only pairs intersect. Perfect for analyzing characters or concepts that share multiple overlapping relationships.
Triple Lens
Similar to Triple Connection, but with a framing that encourages perspective-taking: each circle reflects a different "lens" or viewpoint. The overlaps then illustrate where perspectives align or conflict. It's great for teaching students to view situations through multiple lenses and understand intersectionality in thought.
Key Features of a Venn Diagram
Circles Representing Sets
Each circle in a Venn diagram represents a distinct set, which could be a collection of items, characteristics, or ideas that share a common property. These sets are visually represented as enclosed spaces, making it easier to conceptualize abstract relationships. The size of each circle, while typically not indicative of the set's magnitude, can be adjusted to emphasize scale or importance in some advanced applications. This visual representation ensures clarity when examining the relationships between sets, regardless of the complexity of the information. Additionally, the distinct boundaries of each circle provide a clear demarcation of individual sets, aiding in the accurate identification of unique and shared attributes.
Overlapping Regions
The overlapping areas of the circles in a Venn diagram signify the shared elements or characteristics between sets. These intersections are critical for identifying commonalities, whether they pertain to ideas, data points, or characteristics of groups. For example, in a comparison of two historical figures, the overlap might represent their shared accomplishments or philosophies, while the non-overlapping areas highlight their unique traits. This visual cue simplifies the process of analyzing relationships by clearly distinguishing what is shared from what is exclusive to each set. Furthermore, the extent of overlap can metaphorically indicate the degree of similarity or connection between the sets being analyzed.
Non-Overlapping Areas
The non-overlapping regions of each circle in a Venn diagram represent elements or ideas that are unique to a particular set. These areas are just as important as the overlaps, as they help to emphasize distinctions and individual characteristics that define a set. For instance, when analyzing customer preferences, non-overlapping regions can highlight unique preferences that are exclusive to a specific demographic. By separating these unique traits visually, a Venn diagram enables a deeper understanding of diversity and differentiation within the analyzed data. This aspect ensures that both shared and exclusive elements are given equal consideration in any comparative analysis.
Universal Set (Optional)
In some cases, a rectangle is drawn around the entire Venn diagram to represent the universal set, encompassing all possible items within the context of the analysis. This addition provides a framework that situates the individual sets within a larger context, making it clear what is included in the scope of the discussion. For example, in a study of ecosystem relationships, the universal set might include all species in the ecosystem, while the individual circles represent specific habitats. By defining this overarching context, the universal set ensures that the diagram remains relevant and comprehensive, offering a holistic view of the relationships under consideration.
Uses of Venn Diagrams
Comparing and Contrasting
Venn diagrams are invaluable tools for comparing and contrasting concepts, ideas, or entities. For instance, students can use them to analyze similarities and differences between characters in a novel, such as their motivations, actions, and outcomes. Similarly, historical events can be compared in terms of causes, impacts, and resolutions. This visual representation allows learners to organize their thoughts clearly and systematically, fostering deeper understanding. By making abstract comparisons tangible, Venn diagrams help users uncover nuanced insights that might be overlooked in textual analysis.
Understanding Relationships
Venn diagrams effectively illustrate how different groups or ideas are related, revealing connections that might not be immediately apparent. For instance, in biology, they can demonstrate the relationships between different species, such as shared traits and unique adaptations. This holistic visualization of relationships aids in grasping the "big picture," making it easier to understand how individual elements contribute to a larger system. Whether in academic studies or organizational analysis, Venn diagrams simplify the complexities of relationships and foster a deeper appreciation for interconnectivity.
Logical Problem Solving
In the fields of mathematics and logic, Venn diagrams are widely used to solve problems involving union, intersection, and complement of sets. For instance, they can help students understand how subsets relate to each other and the larger universal set. Logical reasoning problems, such as determining commonalities and exclusions among datasets, become more accessible with this visual tool. The clarity provided by the diagram's structure makes abstract operations like union and intersection intuitive and straightforward, bridging the gap between conceptual understanding and practical application.
Visual Representation of Data
In data analysis, Venn diagrams are used to visually represent relationships between datasets, such as overlapping customer segments or intersecting trends. For example, in market research, a Venn diagram can reveal which customer groups share preferences for certain products or services. This visual approach makes complex datasets more digestible, enabling analysts to identify patterns and insights with ease. By breaking down data into overlapping and exclusive categories, Venn diagrams streamline the process of identifying opportunities, challenges, and relationships within the data.
The Benefits
Simplifies Complex Information
Venn diagrams are an effective tool for breaking down and organizing complex information into manageable parts. By visually representing data or ideas, they make intricate relationships easier to comprehend and analyze. For example, in a research project comparing ecosystems, a Venn diagram can simplify the overlap of species or environmental factors. This visual clarity reduces cognitive overload, allowing individuals to focus on the key aspects of the information being analyzed. Moreover, the clear structure of a Venn diagram makes it a universal tool that can be understood across different levels of expertise, from beginners to advanced users.
Enhances Critical Thinking
Using Venn diagrams actively promotes critical thinking by encouraging users to analyze relationships, similarities, and differences between sets. This process requires deliberate thought to determine what elements belong in overlapping regions versus unique sections. For instance, when comparing two historical events, students must evaluate causes, consequences, and shared themes, fostering a deeper engagement with the material. This analytical exercise helps develop skills in categorization, pattern recognition, and logical reasoning. The act of constructing a Venn diagram is itself a form of critical analysis, as it demands careful consideration of how elements relate within a broader context.
Flexible Application
One of the greatest strengths of Venn diagrams is their flexibility, as they can be adapted for use in almost any subject area or discipline. In literature, they can be used to compare characters, themes, or plotlines, while in science, they are valuable for exploring relationships between species, chemical properties, or experimental outcomes. Business professionals can use them to analyze customer segments, product features, or market trends, making the diagrams a practical tool for decision-making and strategy development. This adaptability ensures that Venn diagrams remain relevant across a wide range of fields, offering a consistent method for tackling problems and organizing information in diverse contexts.
Engages Learners
Venn diagrams are particularly effective at engaging learners, especially those who benefit from hands-on and visual learning approaches. By encouraging active participation, such as labeling sets and arranging data, Venn diagrams make learning an interactive and stimulating process. For visual learners, the diagram's format provides an intuitive way to absorb and retain information. Additionally, the creative aspect of drawing and customizing the diagram makes the learning experience more enjoyable and personalized. This engagement not only improves comprehension but also fosters a sense of ownership over the material, motivating learners to delve deeper into the subject matter.