Data Analytics Worksheets


About Our Data Analytics Reading Worksheets
Think of data analytics as being a modern-day detective-but instead of chasing fingerprints, you're tracking patterns hidden inside numbers. These worksheets introduce students to the skills and steps needed to collect information, look for trends, and make better decisions, whether that's in sports, healthcare, or business. Starting from scratch, they explain in plain, everyday language how data is gathered, cleaned, visualized, and interpreted, all through examples that connect directly to real life. By the end, learners stop seeing data as just spreadsheets and start recognizing it as a story waiting to be read.
Why does this matter? Because we live in a world swimming in data. Our devices count our steps, shops track our purchases, schools monitor our progress-and those numbers influence decisions big and small. These worksheets show how those numbers get turned into actions, revealing both the power and pitfalls of relying on data. Students learn to ask sharper questions, like "What's really behind this chart?" or "Could this data be misleading?" so they can be informed, not fooled.
By blending simple explanations with engaging visuals and real-world case studies, the materials help students connect the dots between data and decision-making. Prompts encourage curiosity and skepticism, like "What would you do if data told two different stories?" The goal is to give students the confidence to not just work with data but to think critically about it-turning them into informed interpreters ready to use analytics as a tool for understanding the world.
A Look At Each Data Analytics Worksheet
Analytics Power
This worksheet shows how small sets of numbers can create big changes when used smartly. It connects analytics to everyday decisions like improving study habits or sports strategies. Students learn that quality often matters more than quantity in data. It leaves them wondering what small insight could make a big difference in their own lives.
Big Data Boom
Here, students explore the three defining features of "big data"-volume, velocity, and variety. They learn how sources like social media and sensors create massive datasets that fuel predictions and trends. The tone is full of discovery without overwhelming with jargon. The final question challenges them to think about where they might find their own big data.
Big Data Challenges
This lesson dives into the messy side of analytics-bad data, missing information, and biases that can throw off results. It explains why cleaning and verifying information is just as important as gathering it. Realistic examples make it clear that more data isn't always better. Students are asked how they'd fix a dataset full of problems.
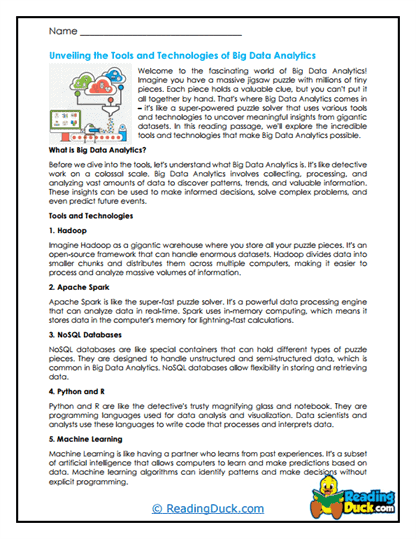
Big Data Tools
Students are introduced to friendly technologies like dashboards, query languages, and visualization software. It explains how these tools turn confusing spreadsheets into clear, actionable insights. Relatable examples make the tech feel accessible. The closing question invites them to choose a tool they'd like to try and explain why.
Business Boost
This worksheet shows how analytics helps companies predict demand, track performance, and understand customers. It connects analytics to decisions that increase profits, improve satisfaction, or reduce waste. Clear examples keep it relevant to everyday experiences. It ends with a challenge to think of a way analytics could improve a favorite store or school.
Data Collection
Students learn where information comes from-surveys, transactions, sensors, and social platforms. It explains why accurate and relevant data is more valuable than just having lots of it. The examples make the idea of "good data" easy to grasp. They're asked what kind of data they would collect to solve a problem in their own lives.
Data Decisions
Here, students discover how evidence replaces guesswork in making smarter choices. The worksheet shows analytics in action in relatable situations like sports, school planning, or budgeting. It demonstrates how patterns in data can point to better outcomes. The final question prompts them to name one decision they would make differently with solid data.
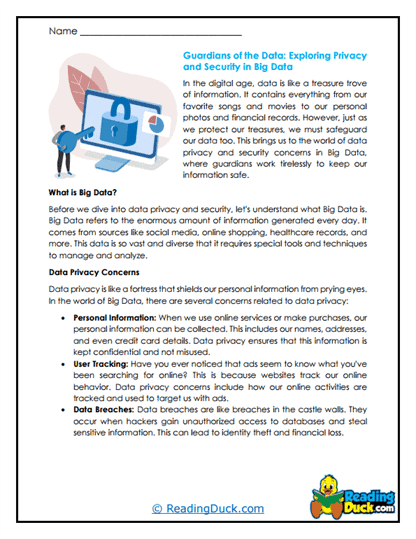
Data Guardians
This lesson focuses on protecting data-privacy, consent, secure storage, and ethical use. Real-life do's and don'ts make the concepts stick. It frames responsibility as part of being a good digital citizen. Students are asked how they would safeguard their own data and someone else's.
Data Treasures
Students see high-quality data as a treasure that's accurate, timely, and trustworthy. The treasure metaphor makes the concept memorable and fun. Examples show why "junk data" isn't worth keeping. It ends with a question about what data treasure they'd go looking for.
Data Wizardry
This worksheet highlights the creative side of analytics, from making predictions to building colorful charts. It presents analytics as both logical and imaginative. Real-world examples include weather forecasting and school planning tools. Students are asked what kind of "data magic" they'd like to create.
Data Worlds
Students imagine worlds powered by analytics-smart cities, personalized education, and more efficient services. The reading connects data to real-world problem-solving in inspiring ways. It encourages thinking beyond current technology. The final question invites them to design their own data-powered world.
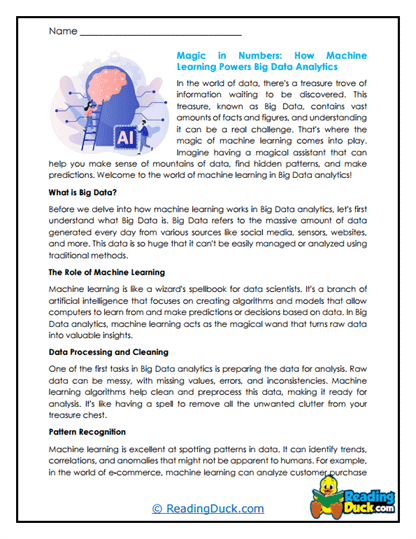
Machine Magic
This one explains how AI and machine learning use data to predict outcomes and automate tasks. It keeps complex ideas clear with simple metaphors and everyday examples. Students see how analytics feeds into future-focused technologies. It ends with a prompt to imagine what a machine could learn from their own personal data.
Data Analytics: From Numbers to Knowledge
Data analytics is the art and science of turning raw numbers into insight. It's how sports teams refine their game plans, doctors predict disease outbreaks, and city planners reduce traffic congestion. Instead of trusting guesswork, analytics lets people test ideas and make choices grounded in evidence, turning data into a reliable guide for smarter actions.
We're surrounded by opportunities for analysis because data is collected almost everywhere-our devices, classrooms, stores, and even public spaces. The constant flow of information can help us forecast trends, detect problems early, and understand patterns that would otherwise stay hidden. For students, learning how this works means gaining a skill that's in demand across industries and useful in everyday life.
The process itself is surprisingly easy to understand when broken down. First comes collection-gathering the right data from the right places. Then it's cleaned, so errors and inconsistencies don't cloud the results. Next, it's analyzed using methods and tools ranging from simple spreadsheets to advanced coding libraries. Finally, it's presented in visuals or summaries that make it easy for others to act on the findings.
Big names like Google, IBM, Microsoft, and Tableau have built entire platforms for analysis, powering industries from healthcare to retail. Doctors use analytics to improve treatments, retailers track trends to adjust their inventories, and coaches break down performance stats to make better plays. This is a skill set shared across science, business, sports, and public policy.
The future of data analytics is both exciting and challenging. While the tools grow smarter-with real-time processing, explainable AI, and local "edge" analysis-questions about privacy, bias, and misuse are becoming more urgent. Learning to analyze data today isn't just about understanding numbers-it's about using them ethically, creatively, and responsibly to build a world guided by knowledge instead of assumption.